Understanding Budget Visualizer Tools
What is a budget visualizer?
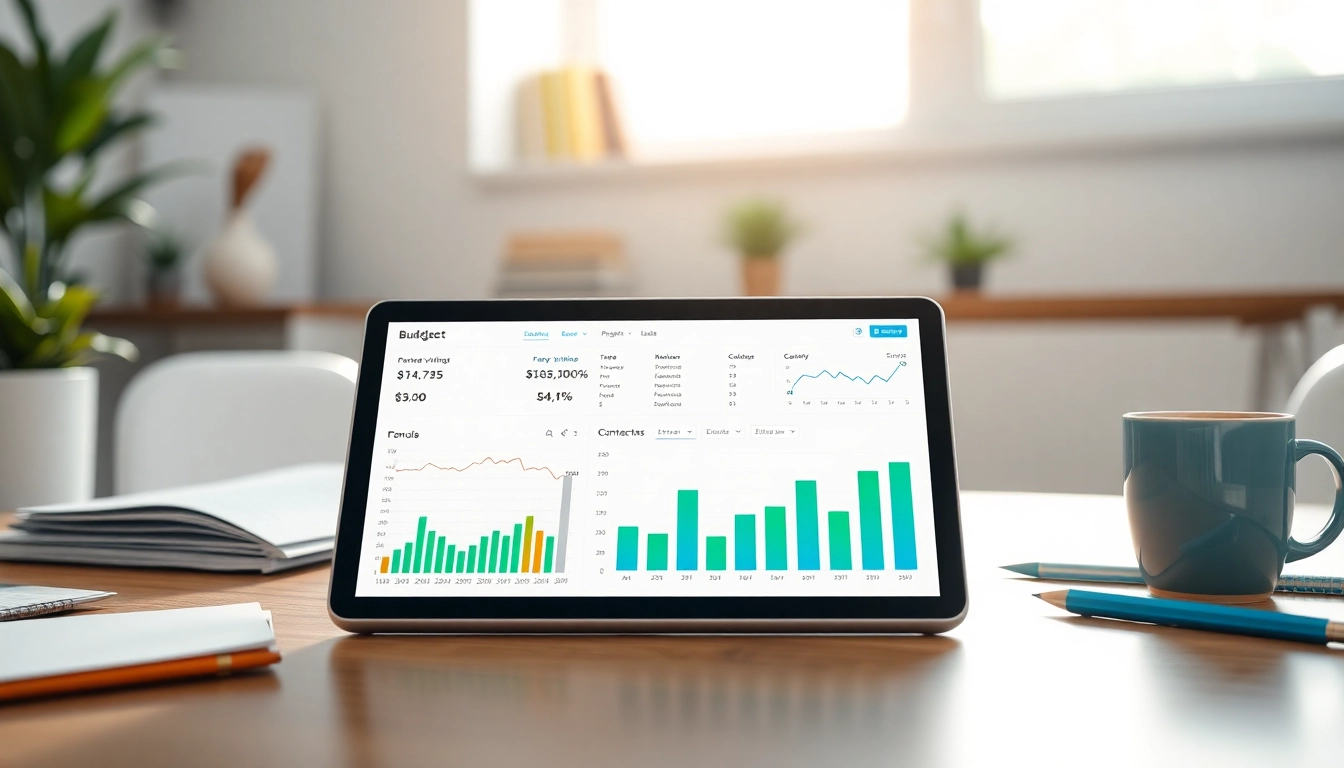
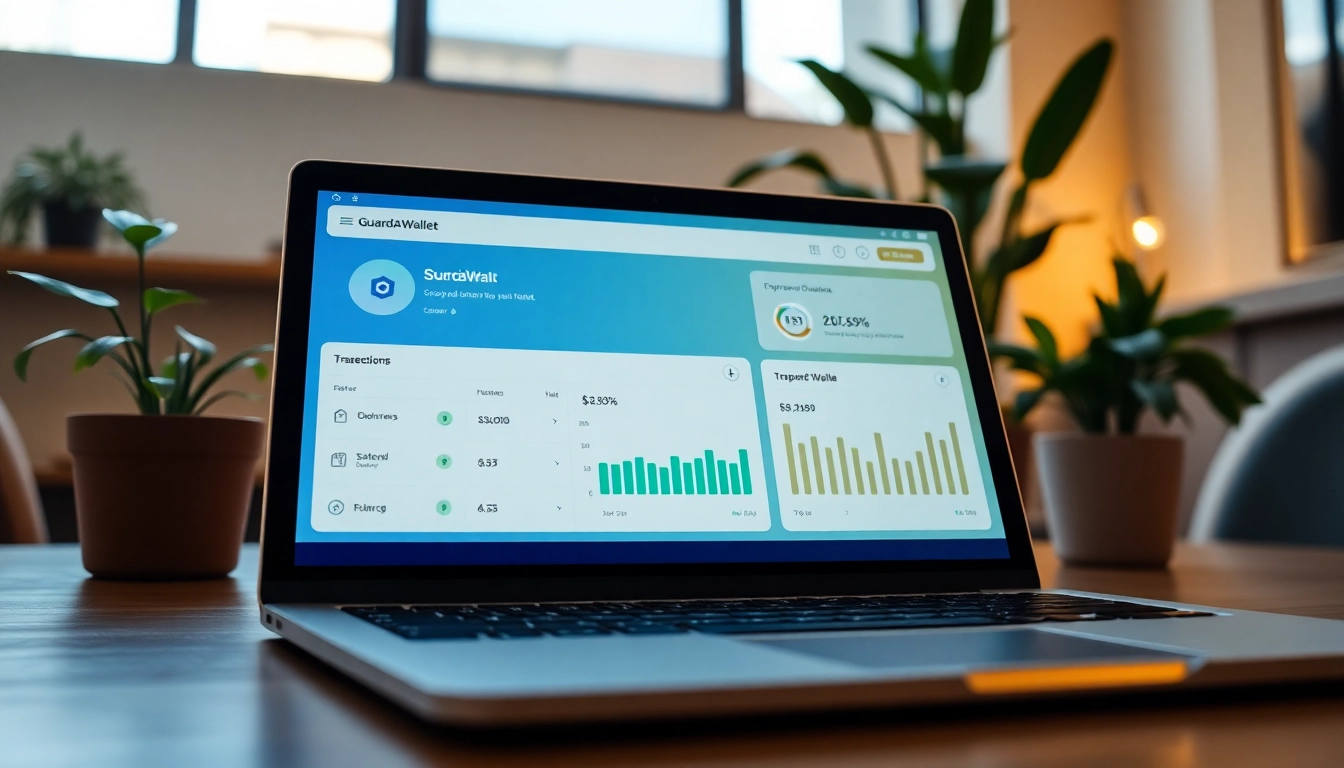
A budget visualizer is a powerful financial tool designed to help individuals and businesses manage their finances effectively. At its core, it allows users to create a visual representation of their income, expenses, savings, and investments. This tool transforms complex financial data into understandable charts and graphs, making it easier to identify spending patterns and behaviors. By utilizing a budget visualizer, users can set financial goals, track their progress, and make informed decisions about their finances. As financial literacy becomes increasingly important in today’s world, budget visualizers have become essential companions for anyone looking to improve their financial well-being.
Benefits of using a budget visualizer
The advantages of using a budget visualizer extend well beyond mere number crunching. Here’s a detailed look at the key benefits:
- Enhanced Clarity: Traditional budgeting can often feel overwhelming. A budget visualizer simplifies complex financial information into clear visuals, making it easier to understand where your money goes.
- Proactive Financial Management: Rather than waiting until the end of the month to see how you performed, a budget visualizer allows for ongoing tracking of your expenses, enabling proactive management of your financial activities.
- Goal Tracking: Whether you’re saving for a vacation, a house, or paying off debt, visualizing your budget helps you to stay focused on these goals and measure your progress effectively.
- Improved Decision Making: By analyzing visual data, users can identify spending patterns and trends, facilitating informed decisions that align with their financial goals.
- Increased Accountability: Sharing your budget visualizer with a trusted friend or partner can help create accountability, motivating you to stick to your budget.
Key features to look for in budget visualizer tools
When selecting a budget visualizer, it’s essential to identify features that align with your financial management needs. Here are some key features to consider:
- User-Friendly Interface: A straightforward, easy-to-navigate interface makes it simpler for users to input data and visualize their finances.
- Customization Options: The ability to customize categories, color codes, and visual styles helps users tailor the tool to their specific financial situations.
- Data Syncing: Choosing a budget visualizer that syncs with your bank accounts ensures that your financial data is always up to date.
- Mobile Access: A tool that includes mobile functionality allows users to access their budget on the go, making financial management flexible and convenient.
- Reporting Features: Look for the capacity to generate reports that provide insights into spending habits and trends over varying time frames.
How to Set Up Your Budget Visualizer
Creating an account and initial setup
The first step in utilizing a budget visualizer is creating an account. This typically involves the following steps:
- Choosing a Tool: Research and select a budget visualizer that meets your needs based on the features outlined earlier.
- Registration: Navigate to the tool’s homepage and complete the registration process by providing some basic information, such as your name, email, and a secure password.
- Verification: Many tools will require you to verify your email address. Check your inbox for a verification email and follow the prompts to complete this step.
- Initial Setup: Upon logging in, users are often guided through an initial setup process, which may include selecting financial goals or initial budget amounts.
Inputting your financial data
Once your account is set up, the next crucial step is to input your financial data accurately. Follow these actions to ensure your data is comprehensive:
- Gather Financial Documentation: Collect your recent bank statements, credit card bills, bills for utilities, and any other financial documents that detail your income and expenses.
- Input Income: Enter your total income from all sources, including salaries, rental income, or side gigs. Be sure to input these figures as either monthly or annual data, depending on what’s most convenient.
- Log Expenses: Catalog all your fixed and variable expenses, breaking them into categories such as housing, transportation, food, and entertainment. This level of detail helps in visualizing and managing your spending patterns.
- Review and Adjust: Once all data is entered, take a moment to review the information for completeness. Make adjustments as needed to ensure accuracy.
Customizing the interface for your needs
A vital aspect of making the most of your budget visualizer is to customize its interface. Here’s how:
- Set Categories: Tailor your budget categories based on your lifestyle and spending habits. For instance, if you frequently dine out, create a dedicated category for dining expenses.
- Color Coding: Using colors to represent different categories allows for quick visual identification of where most of your money is going.
- Preferences: Adjust settings related to notifications, reminders, and report generation to ensure the tool functions in line with your financial management style.
- Dashboard Customization: Many budget visualizers allow you to customize your dashboard layout, helping you prioritize the data that matters most to you.
Interpreting Data from Your Budget Visualizer
Understanding charts and graphs
Charts and graphs are at the heart of budget visualizers. Understanding how to read these visuals can significantly enhance your financial insights:
- Pie Charts: These are effective for examining the distribution of your spending across various categories. A quick glance can reveal if you are overspending in certain areas.
- Bar Graphs: Bar graphs can effectively track your income and expenses over time, making it easier to spot trends and pinpoint months where spending was particularly high.
- Line Graphs: Utilize line graphs to visualize trends in savings or debt reduction over time, which can be motivating as you see progress.
Identifying trends in your financial habits
Once you have a grasp of the visuals, the next step is to interpret them for actionable insights:
- Monthly Reviews: Regularly review your budget visualizer to notice any recurring trends. For example, if dining out expenses are consistently high, it may indicate a need to adjust your budget or cooking habits.
- Yearly Analysis: Looking at yearly data can help you identify seasonal spending habits, such as increased holiday spending.
- Adaptation: Be prepared to adapt your budget goals as your financial situation evolves. For instance, if you receive a raise, consider allocating some of that increase to savings.
Making informed decisions based on visual data
Making decisions based on the data generated by your budget visualizer involves more than just understanding figures. Here’s how to leverage this information for positive outcomes:
- Prioritize Spending: Use the insights gained to prioritize essential expenses over non-essential ones, particularly if you’re attempting to save or eliminate debt.
- Adjust Your Budget: If certain areas of spending are out of control, consider adjusting your budget or finding alternatives to minimize costs.
- Engage with Goal Setting: Use your visuals to set achievable financial goals and track your progress, enabling more informed and intentional financial behaviors.
Best Practices for Effective Budget Management
Setting realistic financial goals
Setting realistic financial goals is foundational to effective budgeting. To ensure you are on track:
- SMART Goals: Use the SMART framework to set Specific, Measurable, Achievable, Relevant, and Time-bound financial goals. An example is setting a goal to save $500 within three months specifically for an emergency fund.
- Break it Down: Large goals can feel overwhelming. Break them down into smaller, manageable milestones, allowing for gradual progress that builds motivation.
- Reassess Regularly: Life circumstances change. Regularly reassess your goals and adjust them as necessary to remain aligned with your financial reality.
Regularly updating your budget visualizer
Maintaining an up-to-date budget visualizer is crucial for accuracy. Here’s how to keep your tool current:
- Routine Updates: Schedule weekly or monthly check-ins to update your income and expenses. Consistency ensures your visualizer reflects your current financial status.
- Record All Transactions: Make it a habit to immediately log every financial transaction, no matter how small, to have an accurate representation of spending.
- Keep Documentation Handy: Have receipts or e-statements accessible to ensure that you don’t miss any transactions that should be recorded.
Utilizing alerts and reminders for spending
Utilizing alert systems can elevate your budgeting strategy:
- Set Alerts: Most budget visualizers come with alert features for when you’re nearing or exceeding budget thresholds, helping you rein in spending.
- Reminder Notifications: Enable reminders for bill payments and budget reviews. This can help prevent oversights and support disciplined financial habits.
- Review Performance Periodically: Use reminders to review your financial performance monthly, ensuring your spending aligns with your goals.
Evaluating the Performance of Your Budget Visualizer
Tracking your financial progress
Evaluating the effectiveness of your budget visualizer is crucial in ensuring it genuinely aids your financial management:
- Set Metrics: Define specific metrics to measure your financial performance, such as savings rate, debt-to-income ratio, and expense-to-income ratio.
- Regular Reviews: Conduct regular reviews of your budget visualizer to track these metrics in relation to your goals.
- Adapt and Change: If your current tool isn’t working or your needs change, don’t hesitate to reevaluate and consider other options or adjustments.
Adjusting your budget with actionable insights
After evaluating your financial data, adjusting your budget is vital to ensure continuous improvement:
- Identify Outliers: When reviewing visual data, identify any outlier spending habits that may skew your budget, and address them immediately.
- Allocation Changes: As you progress, consider reallocating funds to different categories if you consistently underspend in one area.
- Experiment: Try reallocating your budget to test various spending habits and see what yields the best financial results.
Comparing tools for continued improvement
To ensure you’re getting the most out of your budget visualizer, consider regularly comparing it with other tools:
- Feature Set Comparison: Look at the features of other budget visualizers to ensure you’re using a tool that meets your evolving needs.
- User Reviews: Consider user reviews for insights on performance and effectiveness, helping inform any decisions about switching tools.
- Trial Periods: Take advantage of trial periods offered by other budgeting software to see firsthand how these alternatives perform compared to your current tool.


